Skip to content
Performance Objectives: Charts for Jira
Powerful reporting app for Jira dashboards
  • Home
  • KPI Examples
  • User Guide
  • Blog
  • YouTube

Author: KPI Advisor

Target Types

August 15, 2023 KPI Advisor
target types 5

Building Jira KPIs: Four Target Types with the Performance Objectives App Are you tired of relying on external tools, such…

Continue Reading →

Posted in: Targets Filed under: All, Goals

Formula Metrics

KPI Advisor
FormulaMetrics

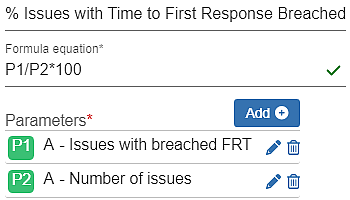
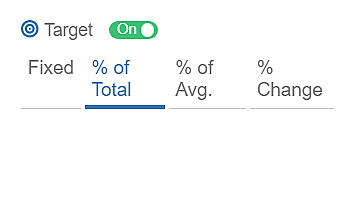
One of the features that set the Performance Objectives app for Jira apart from other charting and reporting tools on…

Continue Reading →

Posted in: Metrics Filed under: All, Metrics

Custom Colors

KPI Advisor
ColorChange3

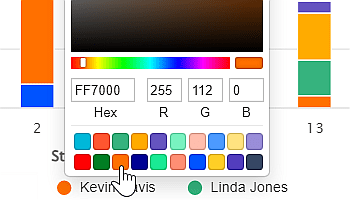
Performance Objectives: Charts for Jira provides a multitude of customization possibilities, including the ability to pick custom colors directly from…

Continue Reading →

Posted in: Customization Filed under: All, Styling

Multiple Metrics

KPI Advisor
MultiMetrics

The Vital Role of Tracking Cycle Time vs Lead Time in Jira Lead time and cycle time are key project…

Continue Reading →

Posted in: Data Grouping, Metrics Filed under: All, Data Analysis, Metrics

Default Table and Pivot Table View

KPI Advisor
Default Pivot

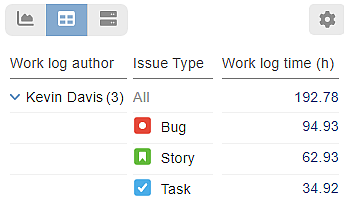
Tables and charts are both valuable tools for presenting data effectively. Each has its own advantages and functions. When deciding…

Continue Reading →

Posted in: Data Grouping, Metrics Filed under: All, Data Analysis

Cumulative Mode

KPI Advisor
CumulativeMode 3

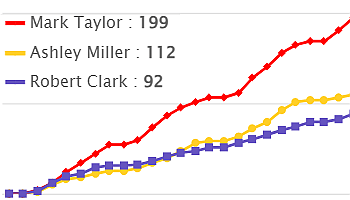
Performance Objectives: Charts for Jira supports cumulative mode configuration option that allows for the accumulation or aggregation of data over time or across different categories.

Continue Reading →

Posted in: Data Grouping Filed under: All, Data Analysis, Metrics

Exclude items with Zero metric values

KPI Advisor

You need to exclude empty dates from your chart in Jira? Performance Objectives: Charts for Jira offers diverse chart result…

Continue Reading →

Posted in: Data Grouping Filed under: All, Data Analysis

By Date Index

KPI Advisor

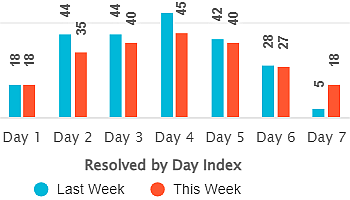
Enhance Period over period analysis – Visualize Jira data using “by date index” in Performance Objectives & Trend gadgets.

Continue Reading →

Posted in: Data Segmentation Filed under: Data Analysis

Date Granularity

August 12, 2023 KPI Advisor
Date By options

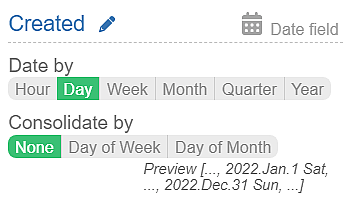
Enhancing Precision with Date-Type Fields and Date Granularity Options in Jira Performance Objectives: Charts for Jira provides support for five…

Continue Reading →

Posted in: Data Grouping Filed under: All, Data Analysis

Range Date

KPI Advisor
RangeDate 1

Range Date Field as a Key to Time-Based Data Insights The Range Date is a key Date field, seamlessly integrated…

Continue Reading →

Posted in: Data Segmentation Filed under: All, Data Analysis

Post navigation

Page 8 of 13
← Previous 1 … 7 8 9 … 13 Next →

BY CATEGORY

  • expandBlog
  • expandGetting Started
  • expandKPI Reports
  • expandSettings
    • expandCustomization
    • expandDashboard Gadgets
    • expandData Grouping
    • expandData Segmentation
    • expandMetrics
    • expandTargets

BY TAG

  • expandAll
  • expandAll KPIs
  • expandData Analysis
  • expandDevelopment KPIs
  • expandGadgets
  • expandGetting started
  • expandGoals
  • expandMetrics
  • expandOperations KPIs
  • expandProject Delivery KPIs
  • expandQA KPIs
  • expandStyling
LEGEND
pin
Number
calendar_month
Date
timer
Time
abc
Text
people
User
M
Metric
F
Field
lock_open
Dependent Field
check
Supported
horizontal_rule
Not Supported
stacked_bar_chart
Performance Objectives Gadget
area_chart
Performance Trend Gadget
donut_small
Circular Chart Gadget
ssid_chart
Multi Metric Trend Gadget
shape_line
Multi Metric Combined Gadget
scatter_plot
Scatter & Bubble Chart Gadget
space_dashboard
Tree Map Gadget
join_full
Venn Diagramm Gadget
blur_on
Heat Map Gadget
history
Change History Gadget
  • Privacy
  • Support
  • Marketplace
  • SLA
  • EULA
  • Security
  • Status
COOKIE AND PRIVACY POLICY
Copyright © 2024 DevAcrobats Ltd. All rights reserved.